Build an AI Sales Dashboard in 30 Minutes: No-Code Step-by-Step Guide
Picture this: You're a sales manager drowning in spreadsheets, struggling to make sense of your team's performance data, and spending hours each week creating reports that are outdated by the time you finish them. What if I told you that you could build a dynamic, AI-powered sales dashboard in just 30 minutes—no coding experience required?
The no-code revolution has fundamentally changed how businesses approach data visualization. According to recent industry statistics, 70% of organizations are planning to leverage no-code solutions to reduce development costs and speed up project timelines. More importantly, firms using AI-driven dashboards have experienced a 40% increase in sales team productivity.
In this comprehensive guide, I'll walk you through creating your first AI sales dashboard using drag-and-drop tools that require zero programming knowledge. By the end, you'll have a real-time visualization of your sales data that automatically updates and provides actionable insights to drive your business growth.
What Is a No-Code AI Sales Dashboard?
A no-code AI sales dashboard is a visual interface that displays your sales data through charts, graphs, and key performance indicators (KPIs) without requiring any programming skills. These dashboards leverage artificial intelligence to process data, identify patterns, and provide predictive insights that help you make informed business decisions.
The "no-code" aspect means you can build these dashboards using intuitive drag-and-drop interfaces, similar to creating a PowerPoint presentation. The AI component automatically analyzes your data, suggests relevant visualizations, and can even predict future sales trends based on historical performance.
No-code tools democratize data access, enabling all team members to contribute to strategic discussions.
— Dr. Lisa F. Meyer, Business Intelligence Expert
Essential Tools for Building Your Dashboard
Before we dive into the step-by-step process, let's explore the most popular no-code platforms that make building AI sales dashboards accessible to everyone:
Google Data Studio (Looker Studio)
Google's free dashboard tool connects seamlessly with Google Sheets, Google Analytics, and hundreds of other data sources. It's perfect for beginners and offers built-in AI features like smart data insights and automatic chart recommendations.
Microsoft Power BI
Power BI provides robust AI capabilities including natural language queries and automated insights. While it has a learning curve, its integration with Microsoft Office makes it ideal for teams already using the Microsoft ecosystem.
Tableau Public
Known for its powerful visualization capabilities, Tableau offers a free public version that's excellent for creating sophisticated dashboards. Its AI-powered "Ask Data" feature lets you query your data using plain English.
Airtable
While primarily a database tool, Airtable's interface designer allows you to create dashboard-like views of your data with minimal effort. It's particularly useful for sales teams tracking leads and customer interactions.
Step-by-Step Guide: Building Your First AI Sales Dashboard
Let's build a comprehensive sales dashboard using Google Data Studio, as it's free and beginner-friendly. This process typically takes 20-30 minutes from start to finish.
Step 1: Prepare Your Sales Data (5 minutes)
First, ensure your sales data is organized in a spreadsheet format. Your data should include columns such as:
- Date of sale
- Salesperson name
- Product or service sold
- Sale amount
- Customer information
- Lead source
- Deal stage
If your data is scattered across different systems, consider using our guide to automating Google Sheets workflows to consolidate everything into one central location.
Step 2: Connect Your Data Source (3 minutes)
Navigate to Google Data Studio and click "Create" > "Data Source." Select your data source (Google Sheets, CSV upload, or direct CRM integration). Data Studio will automatically detect field types and suggest optimizations.
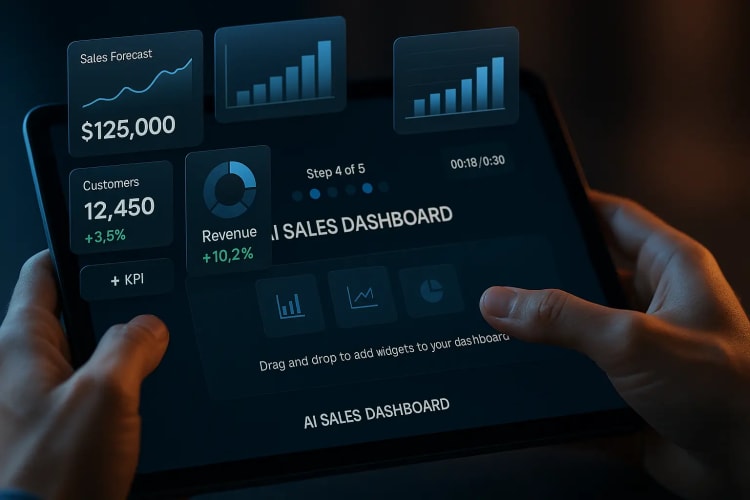
Step 3: Create Your Dashboard Layout (10 minutes)
Start with a blank report and add the following essential components:
- Revenue Scorecard: Display total revenue for the current period
- Sales Trend Chart: Show revenue over time using a line chart
- Top Performers Table: List your best-performing salespeople
- Product Performance Chart: Visualize which products are selling best
- Pipeline Status: Show deals in different stages
Step 4: Apply AI-Powered Insights (5 minutes)
Data Studio's AI capabilities will automatically suggest insights and anomalies in your data. Enable these features by:
- Adding calculated fields for metrics like conversion rates
- Using the "Insights" panel for automatic trend detection
- Setting up alerts for significant changes in performance
Step 5: Customize and Share (7 minutes)
Apply your brand colors, add filtering options for different time periods, and set up automated email reports. Share the dashboard with your team by adjusting viewing permissions.
Key Performance Indicators (KPIs) Every Sales Dashboard Needs
Your dashboard should focus on metrics that directly impact your business growth. Here are the essential KPIs to include:
Revenue Metrics
- Total revenue (monthly, quarterly, yearly)
- Average deal size
- Revenue growth rate
- Recurring vs. one-time revenue
Pipeline Metrics
- Number of qualified leads
- Conversion rate by stage
- Average sales cycle length
- Pipeline value and velocity
Team Performance Metrics
- Individual salesperson performance
- Activity metrics (calls, emails, meetings)
- Win/loss ratios
- Customer acquisition cost
Advanced Features: Automating Your Dashboard
Once your basic dashboard is running, you can enhance it with automation features that save time and provide deeper insights:
Automated Data Refresh
Set up your dashboard to automatically pull fresh data from your CRM or sales tools. Most platforms offer real-time or scheduled updates, ensuring your dashboard always reflects current performance.
Predictive Analytics
Leverage AI to forecast future sales based on historical trends. Tools like Tableau and Power BI offer built-in forecasting models that can predict revenue for upcoming quarters.
Alert Systems
Configure alerts that notify you when KPIs hit certain thresholds. For example, get an email when monthly revenue drops below target or when a high-value deal stalls in the pipeline.
For more advanced automation techniques, check out our comprehensive guide to AI analytics tools that can take your dashboard to the next level.
Common Pitfalls and How to Avoid Them
Building your first sales dashboard can be straightforward, but here are common mistakes that can derail your efforts:
Information Overload
Don't try to cram every possible metric into one dashboard. Focus on 5-7 key metrics that directly impact decision-making. You can always create additional dashboards for different audiences or purposes.
Poor Data Quality
Your dashboard is only as good as your data. Ensure consistent data entry practices and regular data cleanup. Consider implementing automated data cleansing techniques to maintain data integrity.
Lack of Context
Raw numbers without context are meaningless. Always include comparisons to previous periods, targets, or industry benchmarks to help viewers understand performance in context.
Ignoring Mobile Optimization
Many sales managers need to access dashboards on mobile devices. Ensure your dashboard is responsive and readable on smartphones and tablets.
Real-World Success Stories
Let me share a quick example of how powerful these dashboards can be. A mid-sized software company implemented a no-code sales dashboard and saw remarkable results within three months:
- Reduced time spent on manual reporting by 80%
- Increased sales team productivity by 35%
- Improved forecast accuracy by 45%
- Identified underperforming products, leading to a 22% increase in overall revenue
The key was focusing on actionable metrics rather than vanity metrics, and ensuring the entire sales team had easy access to real-time data.
Frequently Asked Questions
What's the best no-code tool for beginners to build sales dashboards?
Google Data Studio (now Looker Studio) is ideal for beginners because it's free, integrates well with common data sources like Google Sheets, and has extensive community support and tutorials. It also offers AI-powered insights that help newcomers understand their data better.
How long does it actually take to build a functional sales dashboard?
A basic but functional sales dashboard can be built in 20-30 minutes using no-code tools. However, expect to spend additional time refining the design, adding automation features, and training your team on how to use it effectively.
Can I automate report generation with these dashboards?
Absolutely! Most no-code dashboard tools offer automated reporting features. You can schedule reports to be emailed to stakeholders daily, weekly, or monthly, and the data will automatically update based on your latest information.
What types of data can I connect to my no-code dashboard?
Modern no-code platforms support hundreds of data sources including CRM systems (Salesforce, HubSpot), spreadsheets (Google Sheets, Excel), databases, social media platforms, email marketing tools, and even custom APIs through integration platforms like Zapier.
Do no-code dashboards provide real-time analytics?
Yes, many no-code platforms offer real-time or near real-time data updates. The refresh frequency depends on your data source and the platform's capabilities, but most can update every few minutes to every hour, which is sufficient for sales monitoring.
What key metrics should every sales dashboard include?
Essential metrics include total revenue, revenue growth rate, pipeline value, conversion rates, average deal size, sales cycle length, and individual team performance. Focus on metrics that directly impact your business decisions rather than trying to track everything.
Are there limitations to customization without coding?
While no-code tools have come a long way, there are some limitations compared to custom-coded solutions. However, for most sales teams, no-code platforms provide more than enough customization options including custom calculations, branding, interactive filters, and various visualization types.
How can I ensure my dashboard data stays accurate?
Implement consistent data entry practices, set up validation rules in your source systems, regularly audit your data for inconsistencies, and consider using automated data cleansing tools. Many no-code platforms also offer data quality alerts to notify you of potential issues.
Taking Your Dashboard to the Next Level
Once you've mastered the basics, consider expanding your dashboard capabilities by integrating advanced features like predictive analytics, AI-powered insights, and cross-platform automation. The no-code ecosystem continues to evolve rapidly, with new tools and capabilities being released regularly.
Remember, the goal isn't to build the most complex dashboard possible—it's to create a tool that helps your sales team make better decisions faster. Start simple, gather feedback from your team, and iterate based on what actually helps improve performance.
Conclusion
Building an AI-powered sales dashboard without coding isn't just possible—it's become essential for competitive businesses. In just 30 minutes, you can create a powerful visualization tool that provides real-time insights, automates tedious reporting tasks, and helps your sales team focus on what they do best: selling.
The no-code revolution has democratized data analytics, putting powerful tools in the hands of every sales manager and business owner. With the global no-code market projected to reach $21.2 billion by 2026, there's never been a better time to embrace these accessible technologies.
Start with one simple dashboard focused on your most critical metrics. As you become comfortable with the tools and see the impact on your team's productivity, you can expand and refine your approach. Your future self—and your sales numbers—will thank you for taking this step today.
Ready to revolutionize how you track and analyze your sales performance? Choose your preferred no-code platform and start building your dashboard today. Have questions or want to share your dashboard success story? Leave a comment below—I'd love to hear about your experience!